Elastic Data Core Components In Cybersecurity


A typical network has a multitude of different logs to keep track of and most of those logs are in different formats. With huge amounts of disparate data, how is it possible to get an overview of network operations while also getting a sense of subtle anomalies or changes in the network? This article talks about all that you need to know about electronic data core components in cybersecurity. 


The Elastic Stack attempts to solve this problem by providing a single interface view into a heterogeneous network. The Elastic Stack consists of Elasticsearch, Logstash, and Kibana (ELK). It is a highly scalable and modular framework for ingesting, analyzing, storing and visualizing data.

Elasticsearch is an open-core platform (open source in the core components) for searching and analyzing an organization’s data in near real-time. It can be used in many different contexts but has gained popularity in network security as a SIEM tool. Security Onion includes ELK and other components from Elastic including:

  • Beats – This is a series of software plugins that send different types of data to the Elasticsearch data stores.
  • ElastAlert – This provides queries and security alerts based on user-defined criteria and other information from data in Elasticsearch. Alert notifications can be sent to a console, or email and other notification systems such as TheHive security incident response platform.
  • Curator – This provides actions to manage Elasticsearch data indices.

Elasticsearch, which is the search engine component, uses RESTful web services and APIs, a distributed computing cluster with multiple server nodes, and a distributed NoSQL database made up of JSON documents. Additional functionality can be added through custom-created extensions.

The Elasticsearch company offers a commercial extension called X-Pack which adds security, alerting, monitoring, reporting, and graphs. The company also offers a machine-learning add-on as well as their own Elastic SIEM product.

Logstash enables the collection and normalization of network data into data indexes that can be efficiently searched by Elasticsearch. Logstash and Beats modules are used to ingest data into the Elasticsearch cluster.

Kibana provides a graphical interface to data that is compiled by Elasticsearch. It enables visualization of network data and provides tools and shortcuts for querying that data in order to isolate potential security breaches.

The core open source components of the Elastic Stack are Logstash, Beats, Elasticsearch, and Kibana, as shown in the figure.


The figure shows the core components of the Elastic Stack: Kibana which is used to access, visualize and investigate data; Elasticsearch which is used to store, index, and analyze data, and Logstash and Beats which is used to acquire or ingest network data.

Elastic Stack Core Components

Logstash
Logstash is an extract, transform and load the system with the ability to take in various sources of log data and transform or parse the data through translation, sorting, aggregating, splitting, and validation. After transforming the data, the data is loaded into the Elasticsearch database in the proper file format. The figure shows some of the fields that are available in Logstash as shown in the Kibana Management interface.

Kibana Management Frame Showing Logstash Index Details
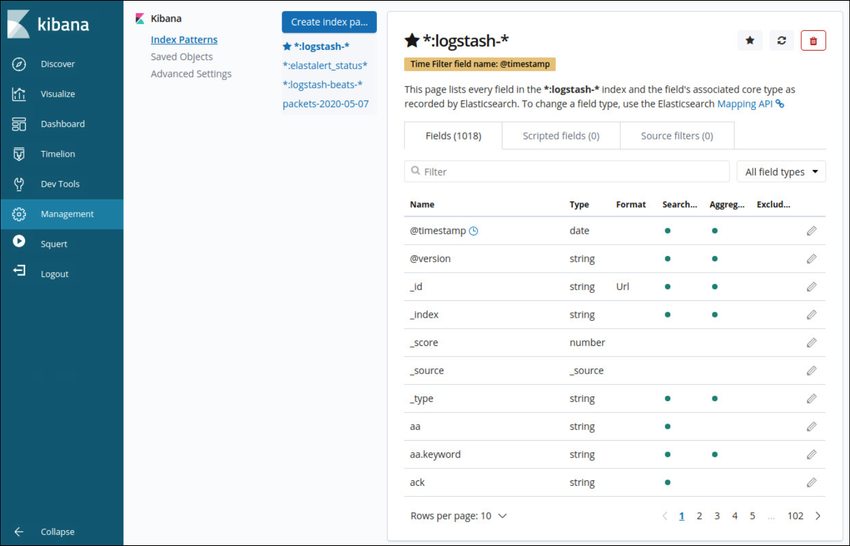
The figure shows the Management page of the Kibana web interface. The Management page is used to view and create data index patterns.
Beats
Beats agents are open source software clients used to send operational data directly into Elasticsearch or through Logstash. Elastic, as well as the open-source community, actively develop Beats agents, so there are a huge variety of Beats agents for sending data to Elasticsearch in near real-time.
Some of the Beats agents provided by Elastic are Auditbeat for audit data, Metricbeat for metrics data, Heartbeat for availability, Packetbeat for network traffic, Journalbeat for Systemd journals, and Winlogbeat for Windows event logs. Some community-sourced Beats are Amazonbeat, Apachebeat, Dockbeat, Nginxbeat, and Mqttbeat to name a few.
Elasticsearch
Elasticsearch is a cross-platform enterprise search engine written in Java. The core components are open-source with commercial addons called X-packs that give additional functionality. Elasticsearch supports near real-time search using simple REST APIs to create or update JavaScript Object Notation (JSON) documents using HTTP requests. Searches can be made using any program capable of making HTTP requests such as a web browser, Postman, cURL, etc. These APIs can also be accessed by Python or other programming language scripts for automated operations.
The Elasticsearch data structure is called an inverted index, which is designed to allow very fast full-text searches. An index is like a database, it is a namespace for a collection of documents that are related to each other. An index can be partitioned or mapped into different types.
If you compare an Elasticsearch index to a traditional relational database, the index is like the database, the types are like the tables, and the documents are like the columns and rows, as shown in the table.
Elasticsearch stores data in JSON-formatted documents. A JSON document is organized into hierarchies of key/value pairs, with a key being a name and the corresponding value is either a string, number, Boolean, date, array, or another type of data.
Kibana
Kibana provides an easy to use graphical user interface for managing Elasticsearch. By using a web browser, an analyst can use the Kibana interface to search and view indices.
The management tab allows you to create and manage indices and there types and formats. The discovery tab is a quick and powerful way to view your data and search it using the search tools.
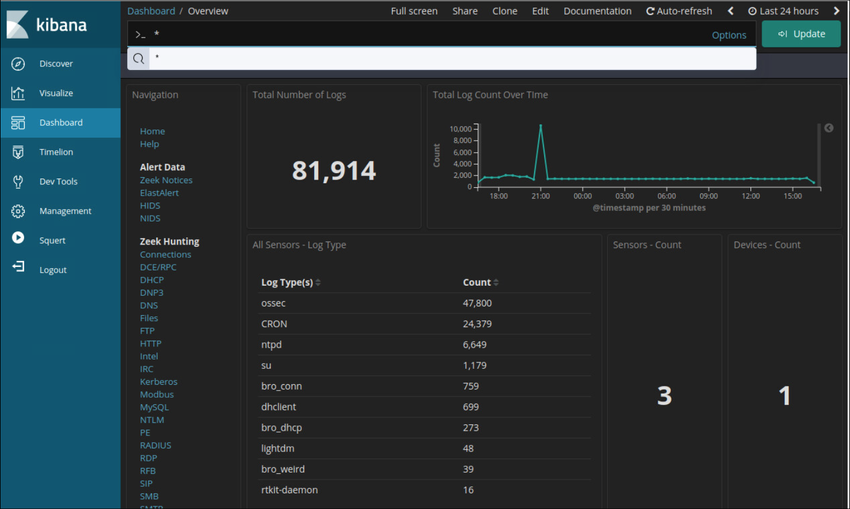
The visualize tab allows you to create custom visualizations like bar charts, line charts, pie charts, heat maps, and more. The visualizations you create can be organized into customized dashboards for monitoring and analyzing your data. A Kibana dashboard is shown in the figure.

A Kibana Dashboard

The figure shows the Overview Dashboard of the Kibana web interface. Dashboards are customizable interfaces for holding data visualizations like pie charts, bar graphs, and data tables and lists.

Data Reduction

The amount of network traffic that is collected by packet captures and the number of log file entries and alerts that are generated by network and security devices can be enormous. Even with recent advances in Big Data, processing, storing, accessing, and archiving NSM-related data is a daunting task.
For this reason, it is important to identify the network data that should be gathered. Not every log file entry, packet, and alert needs to be gathered. By limiting the volume of data, tools like Elasticsearch will be far more useful, as shown in the figure.
Some network traffic has little value to NSM.
Encrypted data, such as IPsec or SSL traffic, is largely unreadable. Some traffic, such as that generated by routing protocols or spanning-tree protocol, is routine and can be excluded. Other broadcast and multicast protocols can usually be eliminated from packet captures, as can traffic from other protocols that generate alot of routine traffic.
In addition, alerts that are generated by a HIDS, such as Windows security auditing or OSSEC, should be evaluated for relevance.
Some are informational or of low potential security impact. These messages can be filtered from NSM data. Similarly, Syslog may store messages of very low severity that could be disregarded to diminish the quantity of NSM data to be handled.
The figure is a simplified representation of how data like PCAPS, logs, and alerts are fed into the Logstash or the Elastic stack and parsed into relevant network security monitoring data.

Data Normalization

Data normalization is the process of combining data from a number of data sources into a common format. Logstash provides a series of transformations that process security data and transform it before adding it to Elasticsearch. Additional plugins can be created to suit the needs of the organization.
A common schema will specify the names and formats for the required data fields. Formatting of the data fields can vary widely between sources. However, if searching is to be effective, the data fields must be consistent.
For example, IPv6 addresses, MAC addresses, and date and time information can be represented in varying formats. Similarly, subnet masks, DNS records, and so on can vary in format between data sources. Logstash transformations accept the data in it’s the native format and make elements of the data consistent across all sources. For example, a single format will be used for addresses and timestamps for data from all sources.

MAC Formats

  • A7:03:DB:7C:91:AA
  • A7-03-DB-7C-91-AA
  • A70.3DB.7C9.1AA

Date Formats

  • Monday, July 24, 2017 7:39:35pm
  • Mon, 24 Jul 2017 19:39:35 +0000
  • 2017-07-24T19:39:35+00:00
  • 1500925254
Data normalization is required to simplify searching for correlated events. If differently formatted values exist in the NSM data for IPv6 addresses, for example, a separate query term would need to be created for every variation in order for correlated events to be returned by the query.

Data Archiving

Everyone would love the security of collecting and saving everything, just in case. However, retaining NSM data indefinitely is not feasible due to storage and access issues. It should be noted that the retention period for certain types of network security information may be specified by compliance frameworks. For example, the Payment Card Industry Security Standards Council (PCI DSS) requires that an audit trail of user activities related to protected information be retained for one year.
Security Onion has different data retention periods for different types of NSM data. For pcaps and raw Bro logs, a value assigned in the securityonion.conf file controls the percentage of disk space that can be used by log files. By default, this value is set to 90%. For Elasticsearch, retention of data indices is controlled by Elasticsearch curator. Curator runs in a Docker container and executes every minute according to cron jobs. Curator logs it’s activity to curator.log. Curator defaults to closing indices older than 30 days. To modify this, change CURATOR_CLOSE_DAYS in /etc/nsm/securityonion.conf. As a disk reaches capacity, Curator deletes old indices to prevent your disk from filling up. To change the limit, modify LOG_SIZE_LIMIT in /etc/nsm/securityonion.conf.
Sguil alert data is retained for 30 days by default. This value is set in the securityonion.conf file.
Security Onion is known to require alot of storage and RAM to run properly. Depending on the size of the network, multiple terabytes of storage may be required. Of course, Security Onion data can always be archived to external storage by a data archive system, depending on the needs and capabilities of the organization.
Note: The storage locations for the different types of Security Onion data will vary based on the Security Onion implementation.
Log entries are generated by network devices, operating systems, applications, and various types of programmable devices. A file containing a time-sequenced stream of log entries is called a log file. By nature, log files record events that are relevant to the source. The syntax and format of data within log messages are often defined by the application developer.
Therefore, the terminology used in the log entries often varies from source to source. For example, depending on the source, the terms login, logon, authentication event, and user connection, may all appear in log entries to describe a successful user authentication to a server.
It is desirable to have consistent and uniform terminology in logs generated by different sources. This is especially true when all log files are being collected by a centralized point. The term normalization refers to the process of converting parts of a message, in this case, a log entry, to a common format.
Action Point
PS: If you would like to have an online course on any of the courses that you found on this blog, I will be glad to do that on an individual and corporate level, I will be very glad to do that I have trained several individuals and groups and they are doing well in their various fields of endeavour. Some of those that I have trained includes staffs of Dangote Refinery, FCMB, Zenith Bank, New Horizons Nigeria among others. Please come on Whatsapp and let’s talk about your training. You can reach me on Whatsapp HERE. Please note that I will be using Microsoft Team to facilitate the training. 

I know you might agree with some of the points that I have raised in this article. You might not agree with some of the issues raised. Let me know your views about the topic discussed. We will appreciate it if you can drop your comment. Thanks in anticipation.


Fact Check Policy

CRMNAIJA is committed to fact-checking in a fair, transparent and non-partisan manner. Therefore, if you’ve found an error in any of our reports, be it factual, editorial, or an outdated post, please contact us to tell us about it.


Fact Check Policy


truehost
telegram
CRMNuggets Whatsapp Channel
About Adeniyi Salau 1549 Articles
Adeniyi Salau is a highly dedicated and committed Blogger of repute. He likes sharing his IT knowledge with others. My desire is to impact as many lives as possible with my IT skills. You can download my mobile APP. Download the ICTLOAD APP on Google Playstore. Thanks.

Be the first to comment

Leave a Reply

Your email address will not be published.


*