

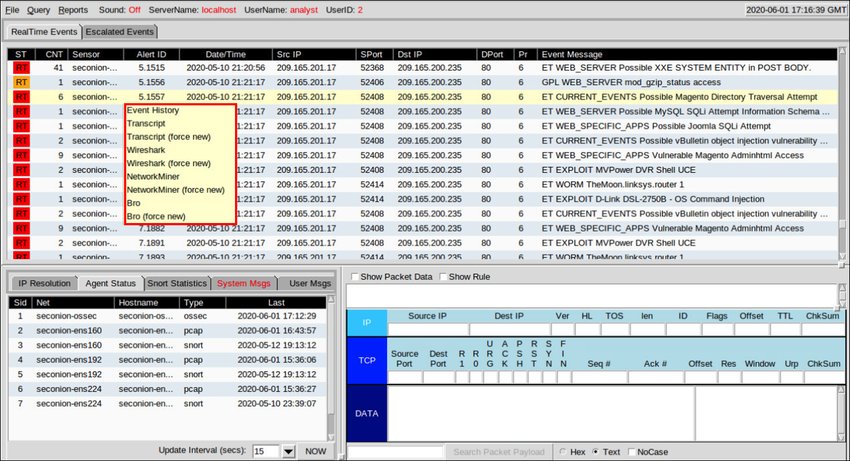
Sguil Alerts Sorted on CNT
Sguil Queries
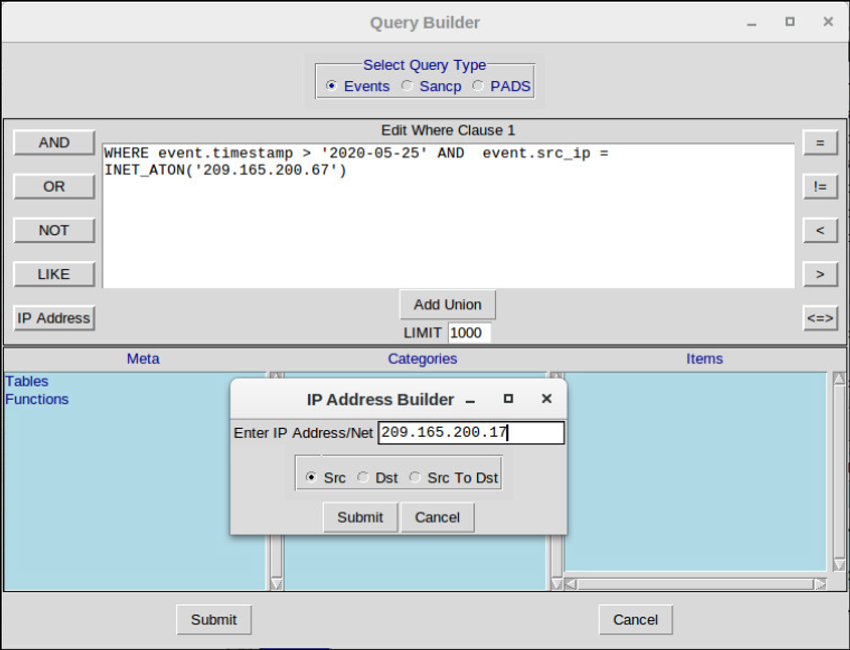
Queries can be constructed in Sguil using the Query Builder. It simplifies constructing queries to a certain degree, but the cybersecurity analyst must know the field names and some issues with field values. For example, Sguil stores IP addresses in an integer representation. In order to query an IP address in dotted-decimal notation, the IP address value must be placed within the INET_ATON() function. Query Builder is opened from the Sguil Query menu. Select Query Event Table to search active events.
The table shows the names of some of the event table fields that can be queried directly. Selecting Show DataBase Tables from the Query menu displays a reference to the field names and types for each of the tables that can be queried. When conducting event table searches, use the pattern event.fieldName = value.
| Field Name | Type | Description |
| sid | int | the unique ID of the sensor |
| cid | int | the sensor’s unique event number |
| signature | varchar | the human-readable name of the event (e.g. “WEB-IIS view source via translate header”) |
| timestamp | datetime | the date and time the event occurred on the sensor |
| status | int | the Sguil classification assigned to this event. Unclassified events are priority 0. |
| src_ip | int | the source IP for the event. Use the INET_ATON() function to covert the address to the database’s integer representation. |
| dst_ip | int | the destination IP for the event |
| src_port | int | the source port of the packet that triggered the event |
| dst_port | int | the destination port of the packet that triggered the event |
| ip_proto | ing | IP protocol type of the packet. (6 = TCP, 17 = UDP, 1 = ICMP, others are possible) |
Pivoting from Sguil
Pivoting from Sguil
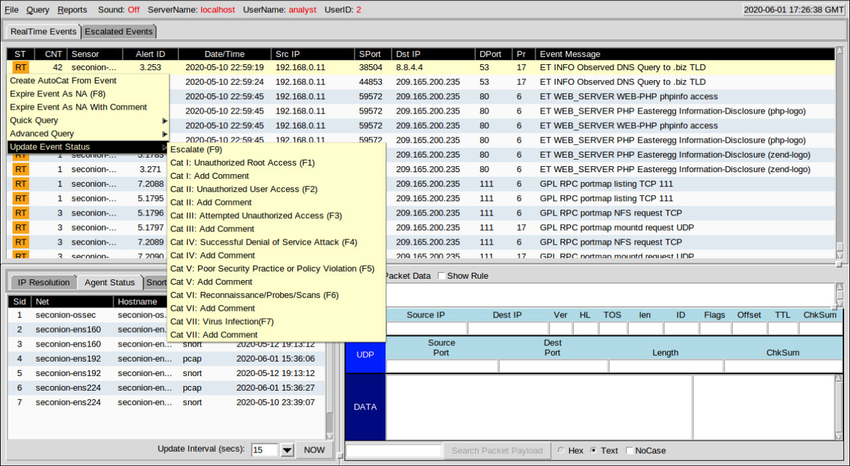
Event Handling in Sguil
Finally, Sguil is not only a console that facilitates the investigation of alerts. It is also a tool for addressing or classifying alerts. Three tasks can be completed in Sguil to manage alerts. First, alerts that have been found to be false positives can be expired.
This can be done by using the right-clicking in the ST column for the event and using the menu or by pressing the F8 key. An expired event disappears from the queue. Second, if the cybersecurity analyst is uncertain how to handle an event, it can be escalated by pressing the F9 key.
The alert will be moved to the Sguil Escalated Events tab. Finally, an event can be categorized. Categorization is for events that have been identified as true positives.
Sguil includes seven pre-built categories that can be assigned by using a menu, which is shown in the figure, or by pressing the corresponding function key. For example, an event would be categorized as Cat I by pressing the F1 key. In addition, criteria can be created that will automatically categorize an event.
Categorized events are assumed to have been handled by the cybersecurity analyst. When an event is categorized, it is removed from the list of RealTime Events. The event remains in the database, however, and it can be accessed by queries that are issued by category.
Event Handling in Sguil
Working in ELK
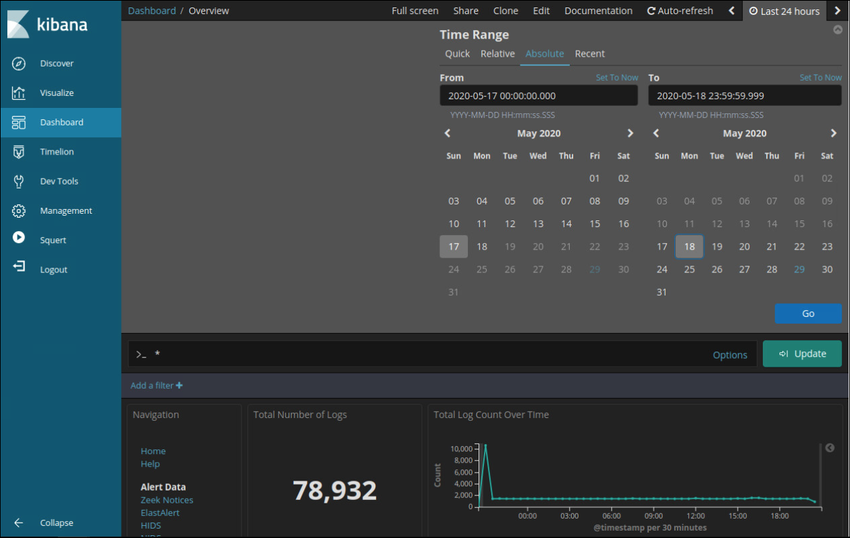
Queries in ELK
Elasticsearch is built on Apache Lucene, an open-source search engine software library that features full-text indexing and searching capabilities. Elasticsearch ingests data into documents called indices and those documents are mapped to various datatypes using index patterns. The index patterns create a data structure of JSON-formatted fields and values. The datatypes in the fields can be in the following formats:
- Core Datatypes: Text (Strings), Numeric, Date, Boolean, Binary, and Range
- Complex Datatypes: Object (JSON), Nested (arrays of JSON objects)
- Geo Datatypes: Geo-point (latitude/longitude), Geo-shape (polygons)
- Specialized Datatypes: IP addresses, Token count, Histogram, etc.)
Using Lucene software libraries, Elasticsearch has its own query language based on JSON called Query DSL (Domain Specific Language). Query DSL features leaf queries, compound queries, and expensive queries.
Leaf queries look for a specific value in a specific field, such as the match, term, or range queries. Compound queries enclose other leaf or compound queries and are used to combine multiple queries in a logical fashion. Expensive queries execute slowly and include fuzzy matching, regex matching, and wildcard matching.
Along with JSON, Elasticsearch queries make use of the following elements: Boolean operators, Fields, Ranges, Wildcards, Regex, Fuzzy search, Text search.
- Boolean Operators – AND, OR, and NOT operators:
- “php” OR “zip” OR “exe” OR “jar” OR “run”
- “RST” AND “ACK”
- Fields – In colon-separated key: value pairs you specify the key field, a colon, a space and the value:
- dst.ip: “192.168.1.5”
- dst.port: 80
- Ranges – You can search for fields within a specific range using square brackets (inclusive) or curly braces (exclusive) range:
- host:[1 TO 255] — Will return events with age between 1 and 255
- TTL:{100 TO 400} — Will return events with prices between 101 and 399
- name: [Admin TO User] — Will return names between and including Admin and User
- Wildcards – The * character is for multiple character wildcards and the ? character for single-character wildcards:
- P?ssw?rd — Will match Password, and P@ssw0rd
- Pas* — Will match Pass, Passwd, and Password
- Regex – These are placed between forward slashes (/):
- /d[ao]n/ — Will match both dan and don
- /<.+>/ — Will match text that resembles an HTML tag
- Fuzzy Search – Fuzzy searching uses the Damerau-Levenshtein Distance to match terms that are similar in spelling. This is great when your data set has misspelt words. Use the tilde (~) to find similar terms:
- index.php~ – This may return results like “index.html,” “home.php”, and “info.php.”
- Use the tilde (~) along with a number to specify how big the distance between words can be:
- term~2 – This will match, among other things: “team,” “terms,” “trem,” and “torn”
- Text search – Type in the term or value you want to find. This can be a field, or a string within a field, etc.
Elasticsearch was designed to interface with users using web-based clients that follow the HTTP REST framework. Queries can be executed using the following methods:
- URI – Elasticsearch can execute queries using URI searches:
- http://localhost:9200/_search?q=query:ns.example.com
- cURL – Elasticsearch can execute queries using cURL from the command line:
- curl “localhost:9200/_search?q=query:ns.example.com”
- JSON – Elasticsearch can execute queries with a request body search using a JSON document beginning with a query element, and a query formatted using the Query Domain Specific Language.
- Dev Tools – Elasticsearch can execute queries using the Dev Tools console in Kibana and a query formatted using the Query Domain Specific Language.
Note: Advanced Elasticsearch queries are beyond the scope of this course. In the labs, you will be provided with complex query statements, if necessary.
Investigating Process or API Calls
Applications interact with an operating system (OS) through system calls to the OS application programming interface (API), as shown in the figure. These system calls allow access to many aspects of system operation such as:
- Software process control
- File management
- Device management
- Information management
- Communication
Malware can also make system calls. If the malware can fool an OS kernel into allowing it to make system calls, many exploits are possible.
HIDS software tracks the operation of a host OS. OSSEC rules detect changes in host-based parameters like the execution of software processes, changes in user privileges, and registry modifications, among many others. OSSEC rules will trigger an alert in Sguil. Pivoting to Kibana on the host IP address allows you to choose the type of alert based on the program that created it. Filtering for OSSEC indices results in a view of the OSSEC events that occurred on the host, including indicators that malware may have interacted with the OS kernel.
Action Point
Get My 66 Page eBook on How to Run Success Ads ON TikTok for 2,000 Naira. Click Here to Buy.
Get my 90 Page ebook on How to Run Ads on Facebook. Click here to buy now.
P.S.: If you need private online training on any of the ICT courses I offer here and you are in Nigeria, please send me a DM on my WhatsApp at +2348103180831. Please note that the Training will be 100percent online. It will be delivered via Zoom or Google Meet.
PS: I know you might agree with some of the points raised in this article or disagree with some of the issues raised.
Please share your thoughts on the topic discussed. We would appreciate it if you could drop your comment. Thanks in anticipation.


Leave a Reply