

Network Logs In Cybersecurity: Facts To Note
NetFlow
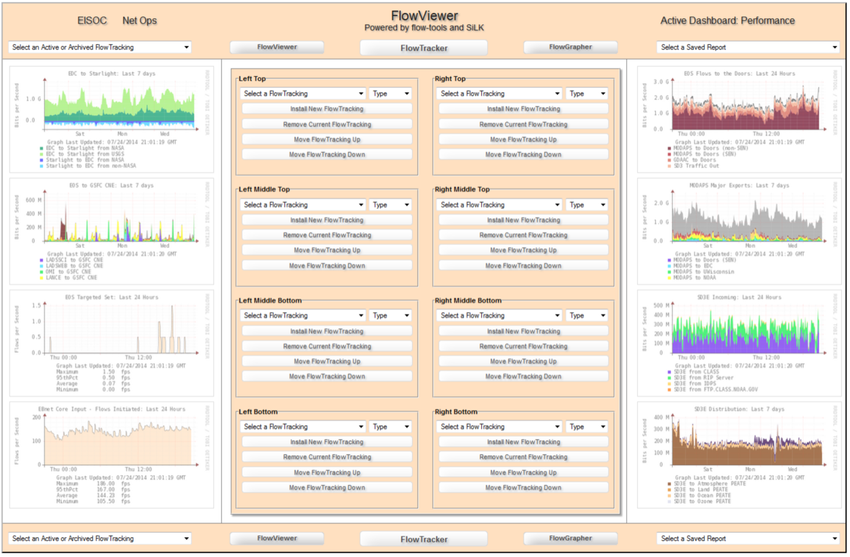
FlowViewer NetFlow Session Data Dashboard
Traditionally, an IP Flow is based on a set of 5 to 7 IP packet attributes flowing in a single direction. A flow consists of all packets transmitted until the TCP conversation terminates. IP Packet attributes used by NetFlow are:
- IP source address
- IP destination address
- Source port
- Destination port
- Layer 3 protocol type
- Class of Service
- Router or switch interface
All packets with the same source/destination IP address, source/destination ports, protocol interface and class of service are grouped into a flow, and then packets and bytes are tallied. This methodology of fingerprinting or determining a flow is scalable because a large amount of network information is condensed into a database of NetFlow information called the NetFlow cache.
All NetFlow flow records will contain the first five items in the list above, and flow start and end timestamps. The additional information that may appear is highly variable and can be configured on the NetFlow Exporter device.
Exporters are devices that can be configured to create flow records and transmit those flow records for storage on a NetFlow collector device. An example of a basic NetFlow flow record, in two different formats, is shown in the figure.
Simple NetFlow v5 Records
Date flow start Duration Proto Src IP Addr:Port Dst IP Addr:Port Flags Tos Packets Bytes Flows2017-08-30 00:09:12.596 00.010 TCP 10.1.1.2:80 -> 13.1.1.2:8974 .AP.SF 0 62 3512 1
Traffic Contribution: 8% (3/37)Flow information:IPV4 SOURCE ADDRESS:10.1.1.2IPV4 DESTINATION ADDRESS:13.1.1.2INTERFACE INPUT:Se0/0/1TRNS SOURCE PORT:8974TRNS DESTINATION PORT:80IP TOS:0x00IP PROTOCOL:6FLOW SAMPLER ID:0FLOW DIRECTION:Inputipv4 source mask:/0ipv4 destination mask:/8counter bytes:205ipv4 next hop address:13.1.1.2tcp flags:0x1binterface output:Fa0/0counter packets:5timestamp first:00:09:12.596timestamp last:00:09:12.606ip source as:0ip destination as:0
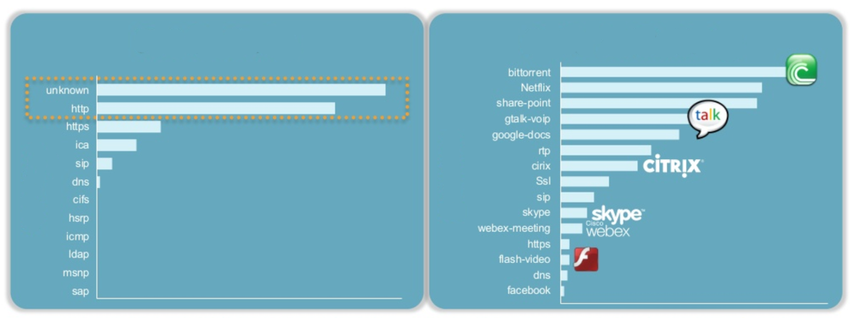
Application Visibility and Control
Cisco Application Visibility and Control

Port Monitoring vs. Application Monitoring
Content Filter Logs
Logging from Cisco Devices
Cisco Syslog Message Formats
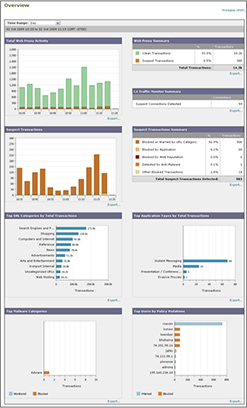
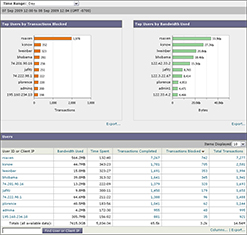
Proxy Logs
DNS Proxy Log Example
1265939281.764 19478 172.16.167.228 TCP_MISS/200 864 GEThttp://www.example.com//images/home.png - NONE/- image/png
| Proxy Log Value | Explanation |
|---|---|
| 1265939281.764 | Time -in Unix epoch timestamp format with milliseconds |
| 19478 | Duration – the elapsed time for the request and response from Squid |
| 172.16.167.228 | Client IP address |
| TCP_MISS/200 | Result – Squid result codes and HTTP status code separated by a slash |
| 864 | Size – the bytes of data delivered |
| GET | Request – HTTP request made by the client |
| http://www.example.com//images/home.png | URI/URL – address of the resource that was requested |
| – | Client identity -RFC 1413 value for the client that made the request. Not used by default. |
| NONE/- | Peering code/Peer host – neighbor cache server consulted |
| image/png | Type – MIME content type from the Content-Type value in the HTTP response header |
Cisco Umbrella, formerly OpenDNS, offers a hosted DNS service that extends the capability of DNS to include security enhancements. Rather than organizations hosting and maintaining blacklisting, phishing protection, and other DNS-related security, Cisco Umbrella provides these protections in its own DNS service.
DNS Proxy Log Example
"2015-01-16 17:48:41","ActiveDirectoryUserName",
"ActiveDirectoryUserName,ADSite,Network",
"10.10.1.100","24.123.132.133","Allowed","1 (A)",
"NOERROR","domain-visited.com.",
"Chat,Photo Sharing,Social Networking,Allow List"
| Field | Example | Explanation |
|---|---|---|
| Timestamp | 2015-01-16 17:48:41 | This is when this request was made in UTC. This is different than the Umbrella dashboard, which converts the time to your specified time zone. |
| Policy Identity | ActiveDirectoryUserName | The first identity that matched the request. |
| Identities | ActiveDirectoryUserName,ADSite,Network | All identities associated with this request. |
| Internal Ip | 10.10.1.100 | The internal IP address that made the request. |
| External Ip | 24.123.132.133 | The external IP address that made the request. |
| Action | Allowed | Whether the request was allowed or blocked. |
| QueryType | 1 (A) | The type of DNS request that was made. |
| ResponseCode | NOERROR | The DNS return code for this request. |
| Domain | domain-visited.com. | This is the domain that was requested. |
| Categories | Chat, Photo Sharing, Social Networking | The security or content categories that the destination matches. |
Next-Generation Firewalls
Common NGFW events include:
Connection Event – Connection logs contain data about sessions that are detected directly by the NGIPS. Connection events include basic connection properties such as timestamps, source and destination IP addresses, and metadata about why the connection was logged, such as which access control rule logged the event.
- Intrusion Event – The system examines the packets that traverse the network for malicious activity that could affect the availability, integrity, and confidentiality of a host and its data. When the system identifies a possible intrusion, it generates an intrusion event, which is a record of the date, time, type of exploit, and contextual information about the source of the attack and its target.
- Host or Endpoint Event – When a host appears on the network it can be detected by the system and details of the device hardware, IP address, and the last known presence on the network can be logged.
- Network Discovery Event – Network discovery events represent changes that have been detected in the monitored network. These changes are logged in response to network discovery policies that specify the kinds of data to be collected, the network segments to be monitored, and the hardware interfaces of the device that should be used for event collection.
- Netflow Event -Network discovery can use a number of mechanisms, one of which is to use exported NetFlow flow records to generate new events for hosts and servers.
Action Point
Get My 66 Page eBook on How to Run Success Ads ON TikTok for 2,000 Naira. Click Here to Buy.
Get my 90 Page ebook on How to Run Ads on Facebook. Click here to buy now.
P.S.: If you need private online training on any of the ICT courses I offer here and you are in Nigeria, please send me a DM on my WhatsApp at +2348103180831. Please note that the Training will be 100percent online. It will be delivered via Zoom or Google Meet.
PS: I know you might agree with some of the points raised in this article or disagree with some of the issues raised.
Please share your thoughts on the topic discussed. We would appreciate it if you could drop your comment. Thanks in anticipation.


Leave a Reply